
Your engagement survey results are in. After weeks of brainstorming questions and nudging employees to participate, you’re ready to roll up your sleeves and act on their feedback. To take that step, you’ll need more than a birds-eye view of the data.
Survey says: Getting to the bottom of your results requires you to crunch the numbers and read between the lines. Before you draft an action plan, follow these steps to get more out of your engagement survey results.
1. Ask the right questions.
The first step of running a game-changing engagement analysis happens before you’ve even launched the survey. Make sure your survey offers opportunities for employees to share both quantitative and qualitative feedback. Leveraging both will give you the most accurate understanding of employee sentiment across dimensions like satisfaction, belonging, and more.
You can get quantitative data using both Likert scale and multiple-choice questions. The first question type isn’t technically a question at all: Employees are prompted to indicate how strongly they agree or disagree with a statement. This quality makes Likert questions especially effective at measuring the intensity of employee sentiment, which is critical for action planning and prioritization. For instance, if employees strongly disagree with the prompt, “This company is invested in my career development” that should be an immediate red flag and stand out from more neutral responses.
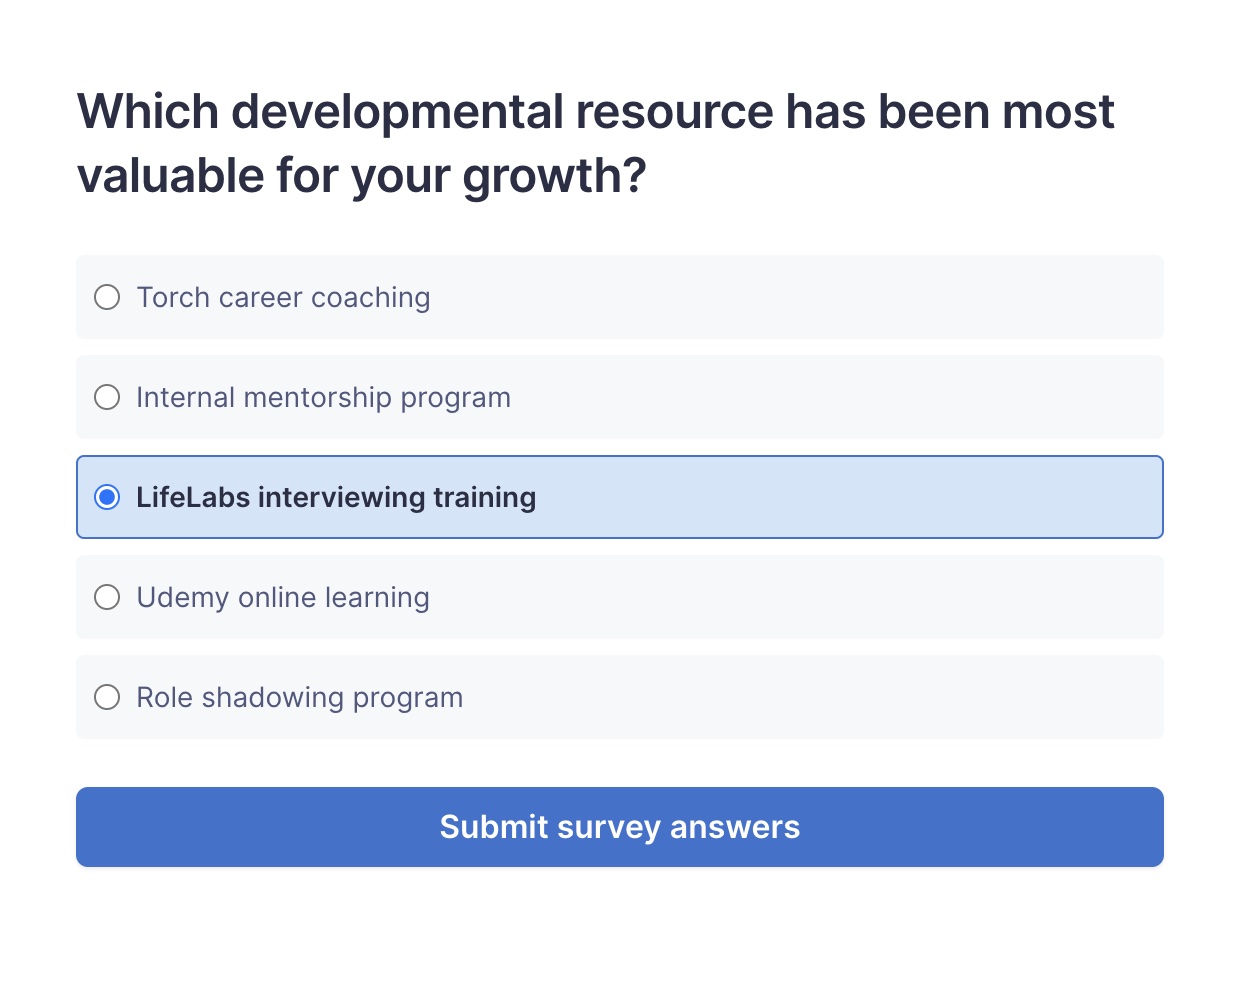
Multiple-choice questions are just as valuable, though they offer a different set of benefits. Offering respondents a range of answers opens the door to more specific feedback. Going back to the example shared earlier, two subsequent multiple-choice questions might ask employees to indicate which career development programs they found the most and least impactful. Combining Likert and multiple-choice questions in this manner opens the door to a much richer analysis.
Lastly, don’t discount qualitative feedback. In the case of employee surveys, this data usually comes in the form of written comments. While these aren’t as easy to analyze, they offer the most specific feedback of all. We’ll touch on how you can analyze this information later on.
2. Look at cross-sections.
Milliseconds after the survey closes, you’ll likely be tempted to look at overall scores. But while high-level averages might give you a pulse on how the organization is doing as a whole, you won’t be able to diagnose issues without more detail. Dive even deeper by filtering your survey results by specific characteristics, including:
- Age
- Department
- Ethnicity
- Gender
- Job category (full-time, part-time, contractor)
- Job level
- Months since last title change
- Office location
- Salary band
- Tenure
In doing so, you might discover both positive and problematic outliers. For example, if certain demographics report feeling disengaged or excluded from company culture, that might call for new diversity and inclusion goals. Conversely, maybe one department or office location is significantly more engaged than the rest of the company. In setting any next steps, you may want to look at what that segment is doing differently.
Have a hypothesis that you'd like to test with your survey? Try to keep potential cross-sections in mind before sending out your next survey. Having these fields in your survey tool or HR information system (HRIS) will make it much easier to reconcile your data and filter results.
3. Consider context and benchmarks.
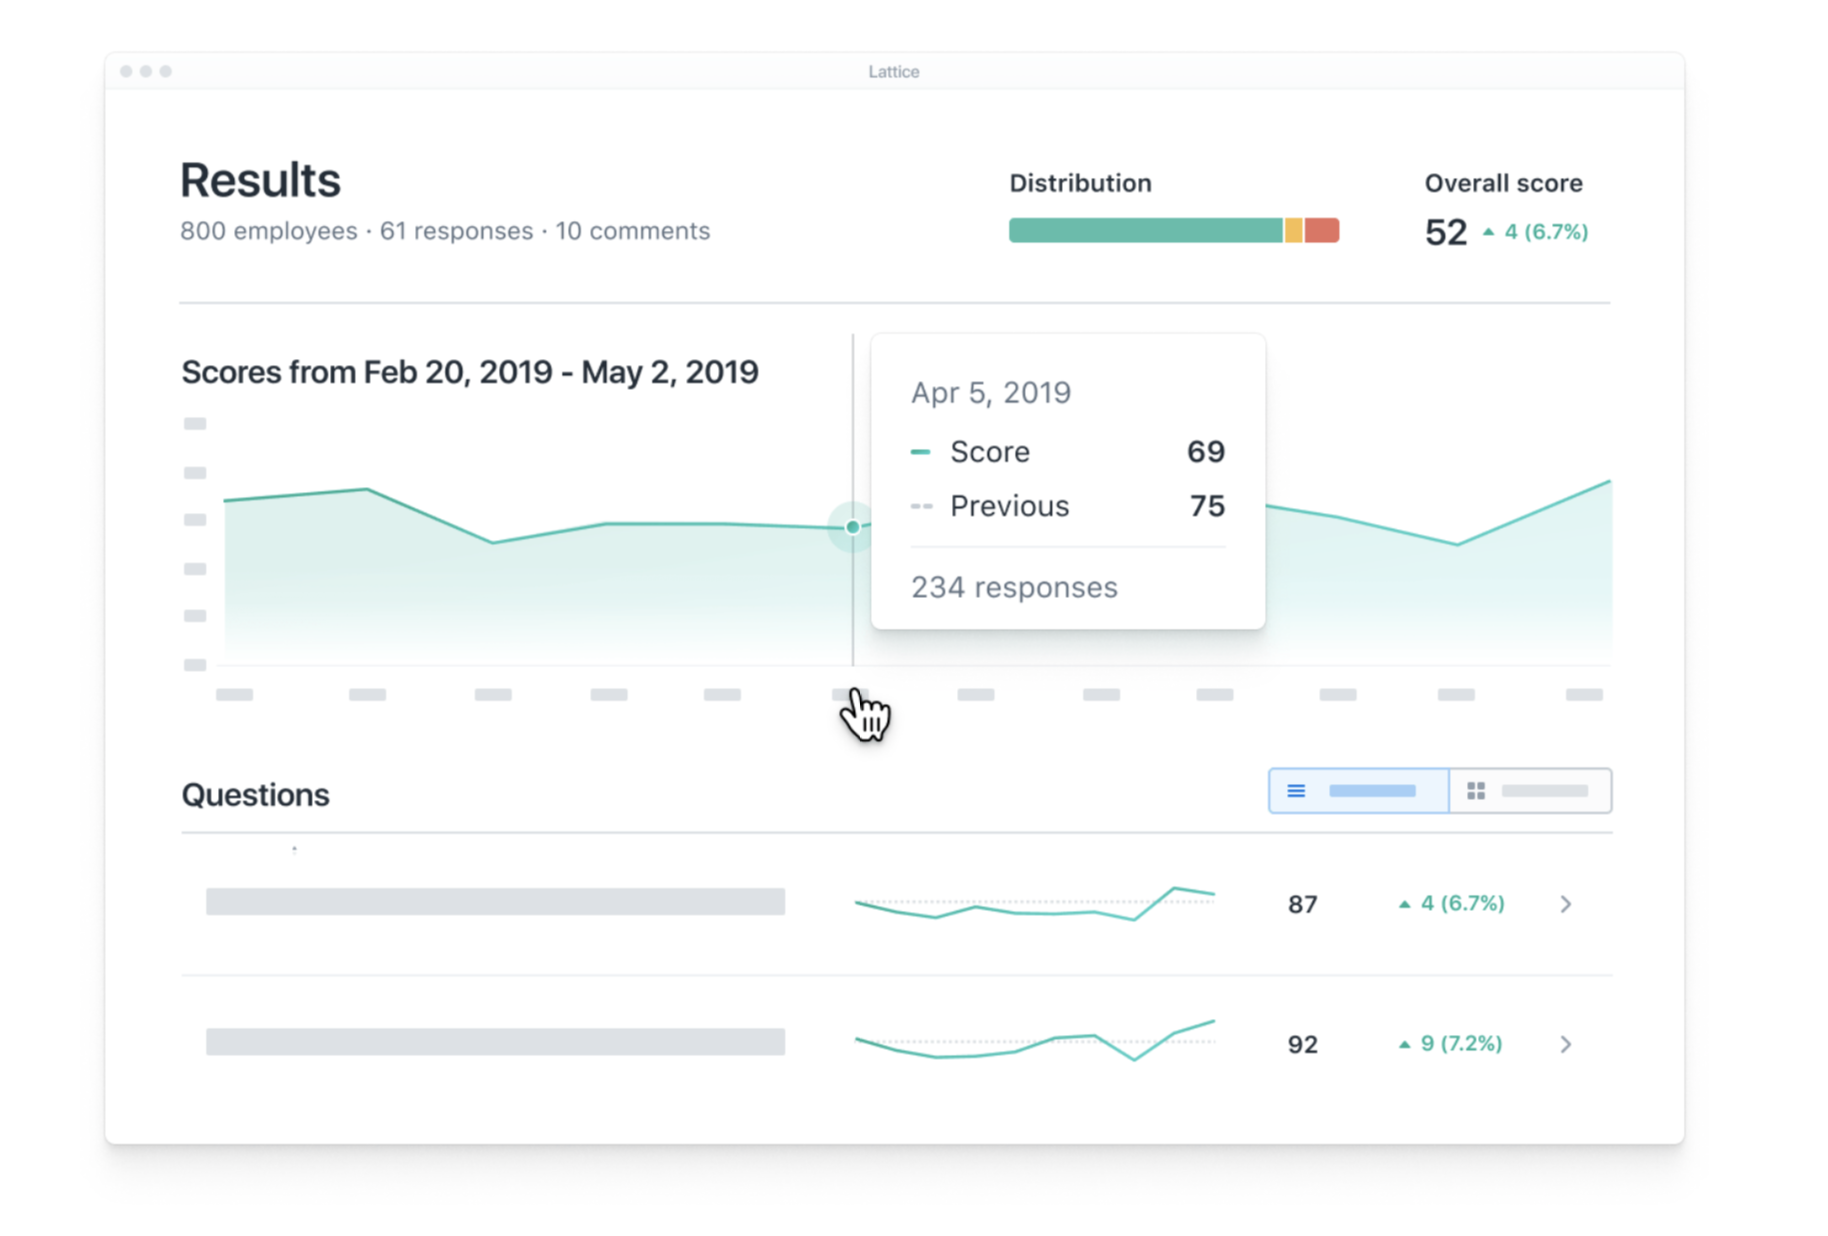
If you’re seeing a shift in engagement since your last survey, consider what happened in that timeframe. Did your business just go through a major event like a layoff? Conversely, did headcount increase significantly? A change in leadership may have also impacted a department’s scores. Considering scenarios like these will give your analysis context.
Remember that scores can also ebb and flow based on seasonality. You’ll want to compare apples to apples. If year-end is your company’s busiest time of year, make sure you’re looking at fourth-quarter results over the last few years. Seeing change along this dimension gives you something more tangible to work with. For example, while your recent engagement scores may have dipped from last quarter, maybe they marked a significant improvement from last year’s results. Whatever changes you implemented since your last busy season may have had a positive impact.
Similarly, consider industry benchmarks for a sense of what “good” looks like. Alone, your scores in the “collaboration” or “work relationships” category might seem troubling. While you always want to improve, maybe those scores are actually on par or better than the industry average. The added perspective can help you prioritize your action planning. If you use engagement software like Lattice, you’ll have access to these benchmarks for specific questions and your overall results.
4. Read the comments.
When crafting your survey, you should always make it an option to leave comments. While harder to analyze, these notes can give you the most telling and direct feedback. Even subtleties like word choice can speak volumes. Using sentiment analysis software can help you distinguish positive, neutral, and negative responses more efficiently.
For smaller teams, reading the comments might take just a few minutes. It can take hours or even days at larger companies. Either way, don’t skimp on this part of your analysis. You’ll want to identify recurring themes along the cross-sections mentioned earlier (department, age, ethnicity, etc.) for even greater insight. While it might be tempting to focus on negative comments, don’t overlook positive feedback. Those notes can help you identify what’s working and whether you need to apply those practices elsewhere.
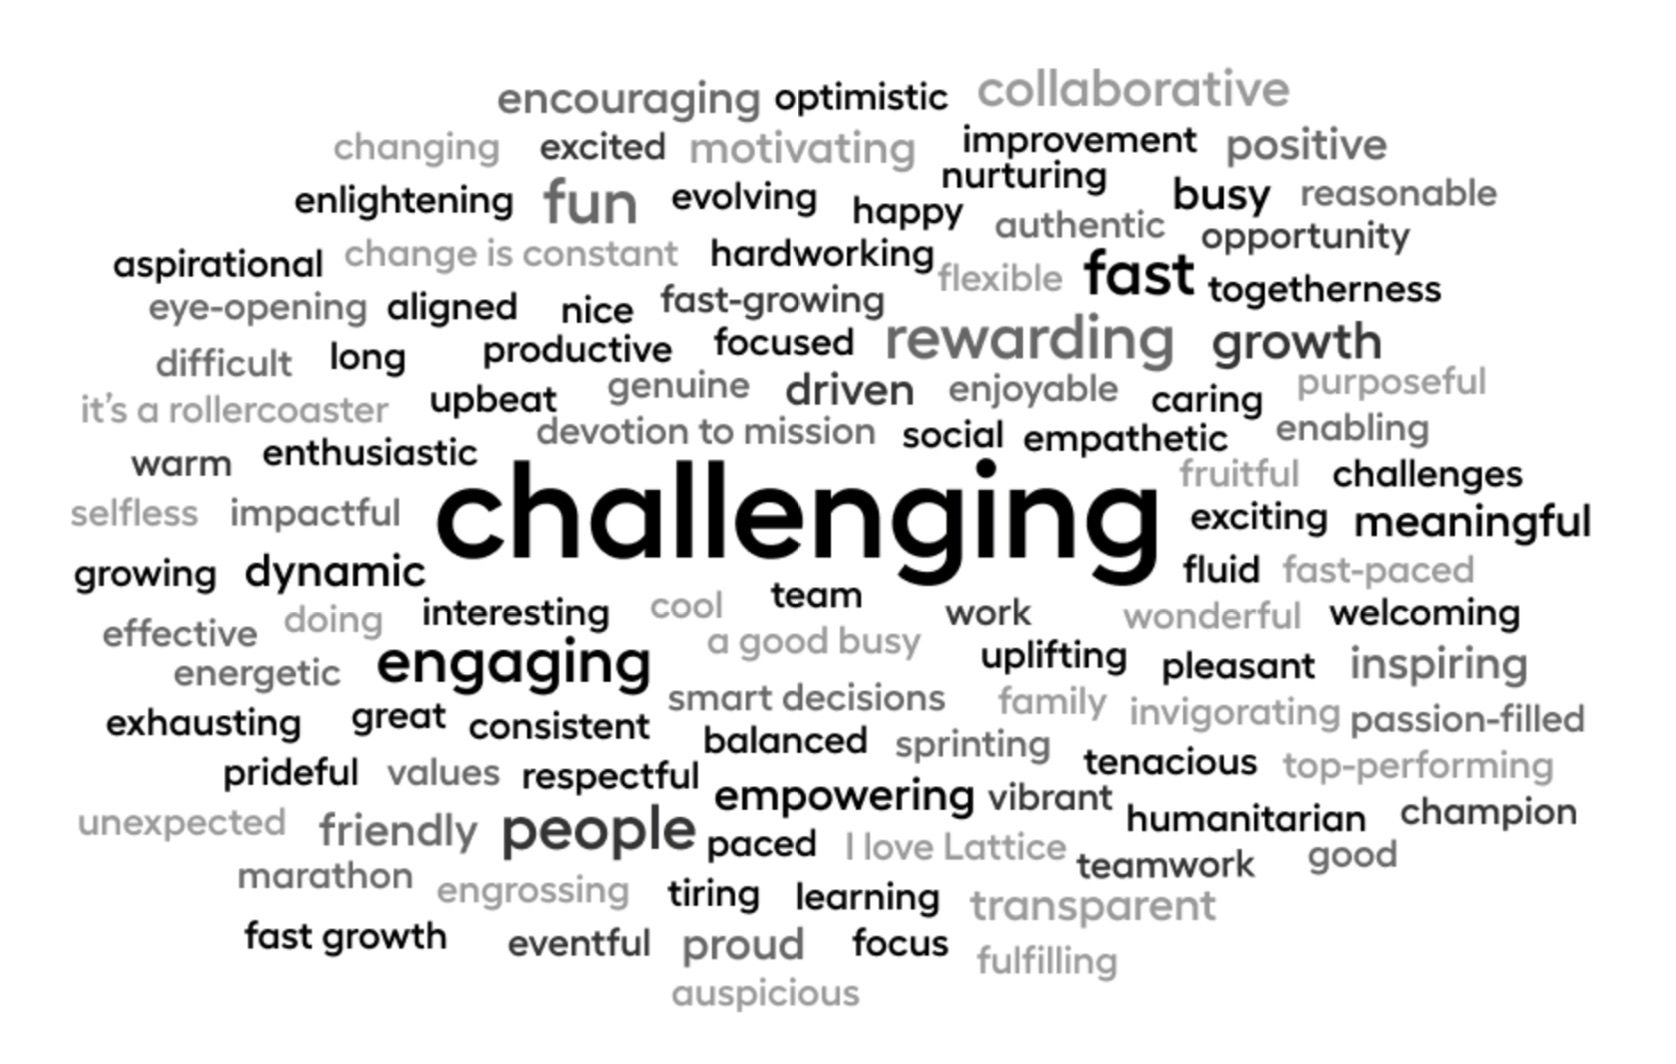
Some teams find it helpful to aggregate results using a world cloud. In addition to helping you identify themes, they also make for powerful visuals when it comes time to share your survey results with leadership and the rest of the company.
5. Filter by performance.
Disengagement is always bad news — but when you discover that it affects your high performers the most, that’s really bad news. Cross-reference your survey results with your latest performance ratings to identify pressing attrition risks. If high performers are consistently bringing up things like lack of career growth or development opportunities in their comments, those insights can help you formulate a response.
When you maintain engagement and performance data in separate platforms, it can be hard to reconcile them while maintaining employee anonymity. When these data sets live together in a people management platform like Lattice, you can easily filter results by performance, manager, and other criteria without compromising employee trust. Learn more about our analytics dashboards here.
6. Experiment with visuals.
A picture is worth a thousand words — don’t limit your analysis to spreadsheets. Some insights only become apparent when you visualize the survey data. Import your results into a data visualization tool and experiment with heat maps, scatterplots, spider charts, and other kinds of graphs. In addition to giving you a new perspective on the data, these visuals are powerful storytelling devices when it comes time to present your findings.
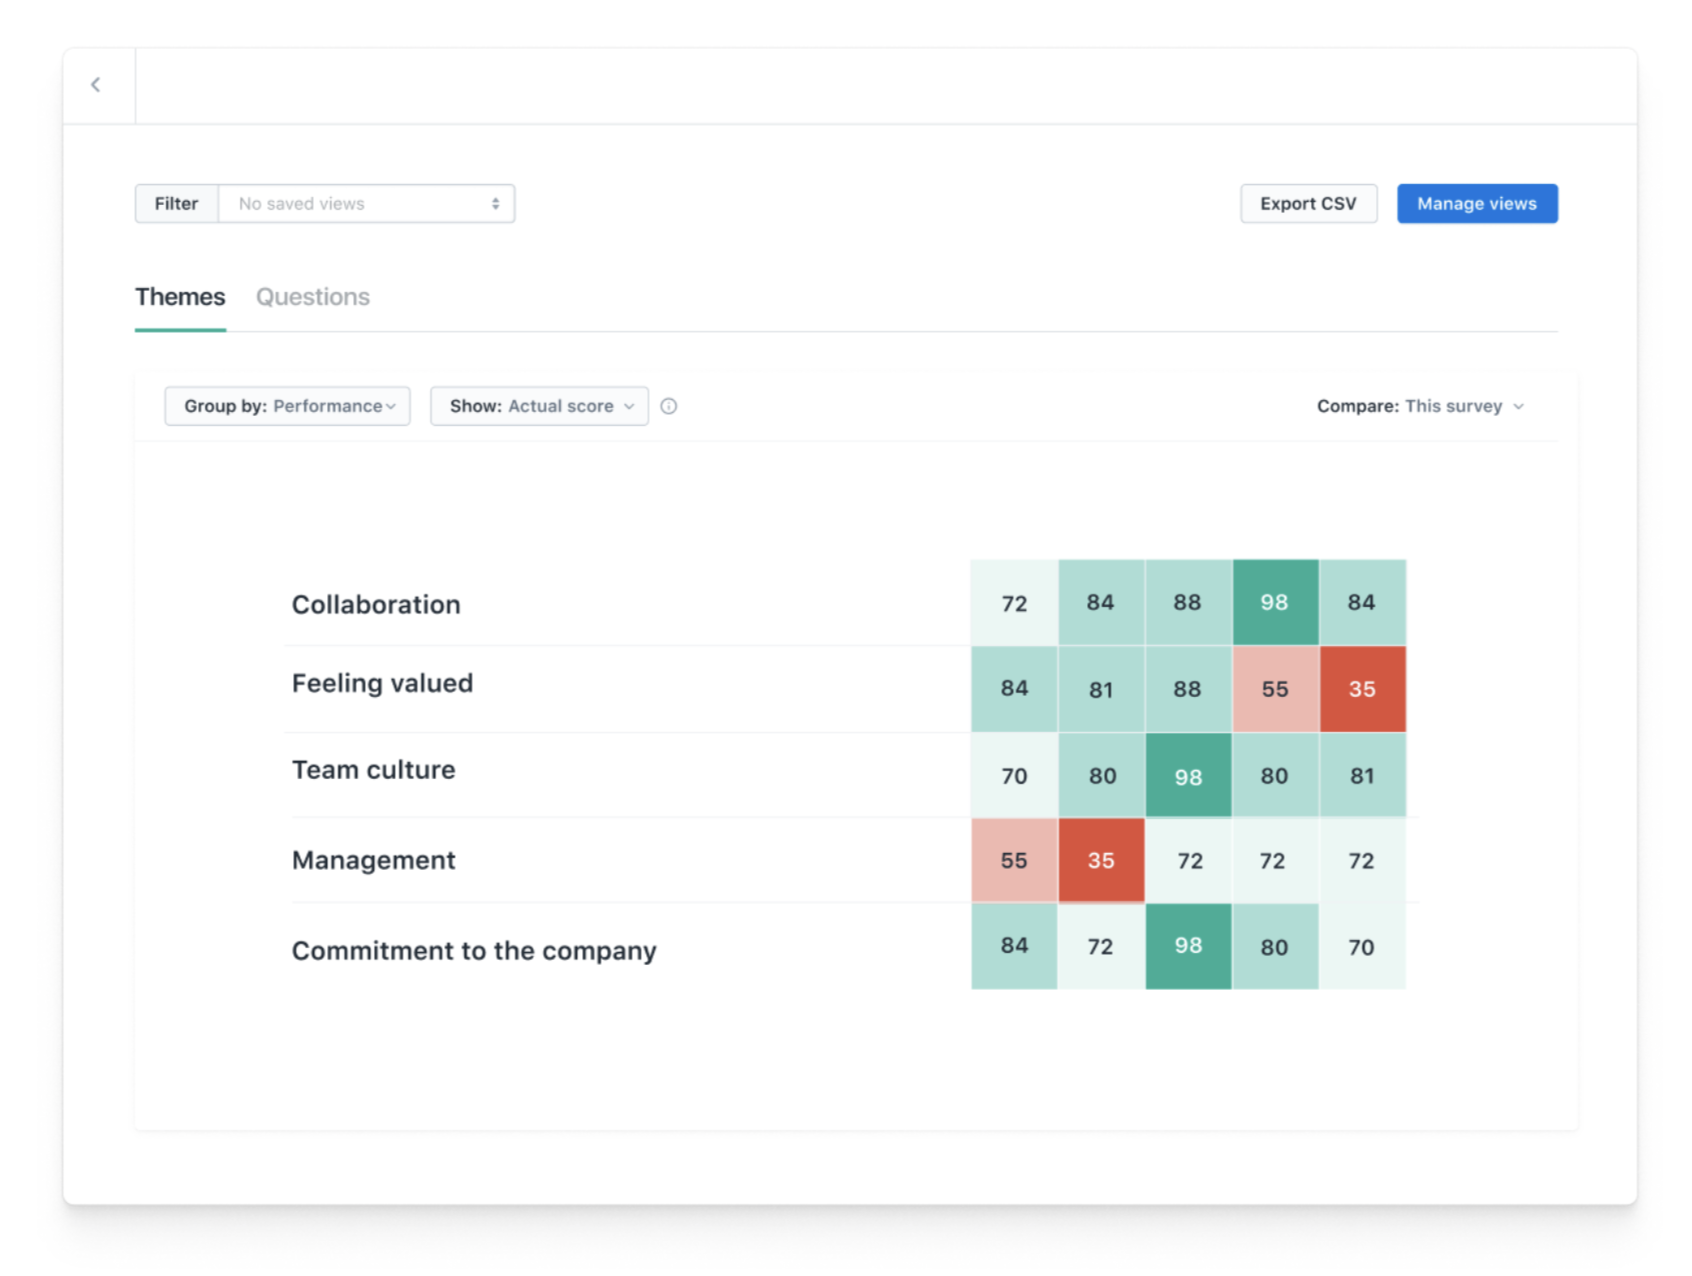
If your engagement survey tool has an open API, you’ll be able to export results into your visualization tool of choice. Some HR platforms have built-in dashboards that allow you to visualize data on the fly. Lattice makes it easy to view engagement and performance data using heat maps, nine-box scatterplots, and other visuals.
—
When you ask employees to complete a survey, they expect that their responses will be put to good use. Analyzing their feedback is the first step in making good on that promise. Next, you’ll need to decide which opportunities to focus on and set goals accordingly. Learn how to make that important leap by reading our ebook, How to Turn Engagement Survey Results Into Action.